
ReplicationControllerやReplicaSetから新しいPodを作成したり、ネームスペースのServiceAccounts、あるいはServiceの新しいEndPointsを作成する場合、kube-controller-managerはこれらのタスクを実行する役割を担います。Kubernetesコントローラーマネージャの監視は、Kubernetesクラスターを適切に運用するための基本です。
もしあなたがクラウドネイティブの旅を続けていて、Kubernetesの上でワークロードを実行しているなら、kube-controller-managerの観測機能を見逃さないでください。Kubernetesコントローラーマネージャで問題に直面した場合、(多くの異なるオブジェクトの中から)新しいPodが作成されることはないでしょう。そのため、Kubernetesコントローラーマネージャーの監視はとても重要なのです!
Prometheusを使ったKubernetesコントローラマネージャーの監視について、また、確認すべき最も重要なメトリクスは何かについてもっと知りたい方は、このまま読み進めてください。
kube-controller-managerとは?
Kubernetesコントローラーマネージャーは、コントロールプレーンのコンポーネントで、各マスターノード上でPod内のコンテナの形で実行されます。その定義は、すべてのマスターノードで、以下のパスにあります:/etc/kubernetes/manifests/kube-controller-manager.yaml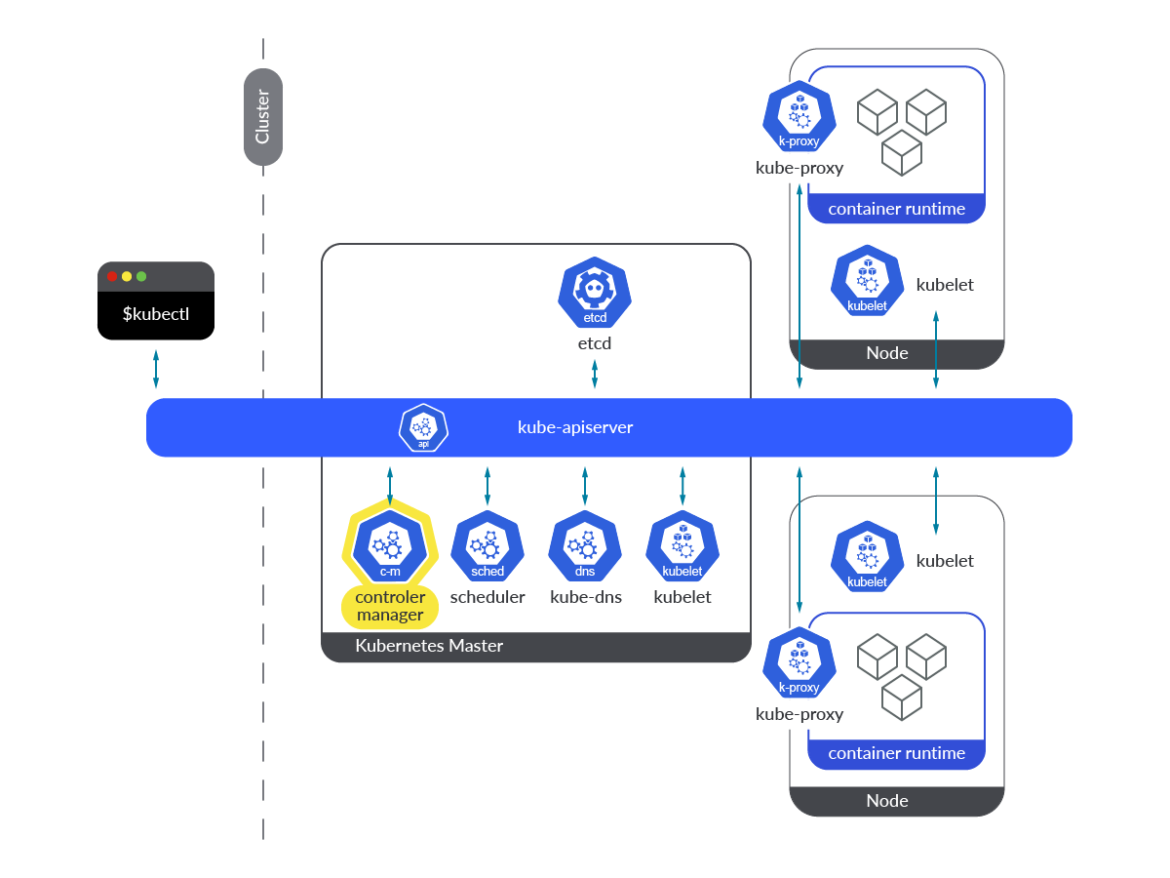
Kube-controller-managerは、異なるKubernetesコントローラのコレクションで、すべてのコントローラーがバイナリーに含まれ、ループ内で永続的に実行されます。その主なタスクは、オブジェクトの状態の変化を監視し、実際の状態が新しい目的の状態に向かって収束することを確認することです。要約すると、Kubernetesオブジェクトの状態にまつわる調整作業を担当しています。
kube-controller-managerで動作するコントローラーは、リソースに変更があるたびに通知を受けるためにウォッチメカニズムを使用します。各コントローラーは、この通知から求められること(作成/削除/更新)に応じて行動します。
kube-controller-manager内では複数のコントローラーが動作しています。それぞれが独自の種類のObjectを調整する責任を負っています。そのうちのいくつかについて説明します。
ReplicaSetコントローラ:このコントローラーはReplicaSetに必要なレプリカの数を監視し、その数とPodセレクターに一致するPodを比較します。このコントローラーは、監視メカニズムを通じて希望するレプリカ数の変更が通知された場合、Kubernetes APIを通じてそれに応じて動作します。本当に必要なレプリカ数より少ないため、新しいPodを作成する必要がある場合、コントローラーは新しいPodマニフェストを作成し、APIサーバーにポストします。Deploymentコントローラー:実際のデプロイメントの状態を、目的の状態と同期させる役割を担います。デプロイメントに変更があった場合、このコントローラーは新バージョンのロールアウトを実行します。その結果、新しいReplicaSetが作成され、新しいPodがスケールアップされ、古いPodがスケールダウンされます。これがどのように実行されるかは、デプロイメントで指定されたストラテジーに依存します。Namespaceコントローラー:ネームスペースを削除する場合、それに属するすべてのオブジェクトを削除する必要があります。ネームスペースコントローラーは、これらの削除タスクを完了させる役割を担っています。ServiceAccountコントローラー:ネームスペースが作成されるたびに、ServiceAccount コントローラは、そのネームスペースにデフォルトの ServiceAccount が作成されるようにします。このコントローラーと同時に、トークンコントローラーも実行され、非同期に動作し、ServiceAccountの作成と削除を監視して、対応するトークンの作成と削除を行います。ServiceAccountのシークレットの作成と削除に適用されます。Endpointコントローラー:Kubernetesクラスター内のEndpointsのリストを更新・管理するコントローラーです。ServicesとPodの両方のリソースを監視します。サービスやPodが追加、削除、更新されると、サービスPodの条件(セレクター)とそのIPとポートに一致するPodをEndpointオブジェクトに選択します。サービスが削除されると、コントローラーは、そのサービスの依存するEndpointsを削除します。PersistentVolumeコントローラー:ユーザーがPersistentVolumeClaim(PVC)を作成すると、Kubernetesはこのリクエストを満たす適切なPersistent Volumeを見つけ、このクレームにバインドする必要があります。PVCが削除されると、ボリュームはバインド解除され、その再請求ポリシーに従って再請求されます。PersistentVolumeコントローラーは、このようなタスクを担当します。
Kubernetesコントローラマネージャーを監視する方法
Kube-controller-managerはinstrumentedで、デフォルトで独自のメトリクスエンドポイントを提供しており、特別なアクションは必要ありません。メトリクスエンドポイントにアクセスするための公開ポートは、Kubernetesクラスターで稼働しているすべてのkube-controller-manager Podの10257です。このセクションでは、メトリクスエンドポイントに直接手動でアクセスするために必要な簡単な手順と、Prometheusインスタンスからメトリクスをスクレイピングする方法について説明します。
注意:デフォルト値を使用してkubeadmでKubernetesクラスターをデプロイした場合、10257ポートに到達してPrometheusからメトリクスをスクレイピングすることが困難となる場合があります。Kubeadmはkube-controller-managerのbind-addressを127.0.0.1に設定するので、ホストネットワーク内のPodのみがメトリクスエンドポイントに到達できます:https://127.0.0.1:10257/metrics.
エンドポイントへのアクセスを手動で取得する
前述のとおり、Kubernetesクラスターのデプロイ方法によっては、kube-controller-managerの10257ポートにアクセスする際に問題に直面する可能性があります。そのため、kube-controller-managerのメトリクスに手動でアクセスするには、コントローラPodを–bind-address=0.0.0.0で起動するか、マスターノード自身からアクセスするか、bind-addressが127.0.0.1ならホストネットワーク内のPodからアクセスするしかありません。$ kubectl get pod kube-controller-manager-k8s-control-1.lab.example.com -n kube-system -o json
…
"command": [
"kube-controller-manager",
"--allocate-node-cidrs=true",
"--authentication-kubeconfig=/etc/kubernetes/controller-manager.conf",
"--authorization-kubeconfig=/etc/kubernetes/controller-manager.conf",
"--bind-address=127.0.0.1",
"--client-ca-file=/etc/kubernetes/pki/ca.crt",
"--cluster-cidr=192.169.0.0/16",
"--cluster-name=kubernetes",
"--cluster-signing-cert-file=/etc/kubernetes/pki/ca.crt",
"--cluster-signing-key-file=/etc/kubernetes/pki/ca.key",
"--controllers=*,bootstrapsigner,tokencleaner",
"--kubeconfig=/etc/kubernetes/controller-manager.conf",
"--leader-elect=true",
"--requestheader-client-ca-file=/etc/kubernetes/pki/front-proxy-ca.crt",
"--root-ca-file=/etc/kubernetes/pki/ca.crt",
"--service-account-private-key-file=/etc/kubernetes/pki/sa.key",
"--service-cluster-ip-range=10.96.0.0/12",
"--use-service-account-credentials=true"
],
…
(output truncated)
十分な権限を持つ
ServiceAccount トークンを使って、Podからcurlコマンドを実行することができます:$ curl -k -H "Authorization: Bearer $(cat /var/run/secrets/kubernetes.io/serviceaccount/token)" https://localhost:10257/metrics
# HELP apiserver_audit_event_total [ALPHA] Counter of audit events generated and sent to the audit backend.
# TYPE apiserver_audit_event_total counter
apiserver_audit_event_total 0
# HELP apiserver_audit_requests_rejected_total [ALPHA] Counter of apiserver requests rejected due to an error in audit logging backend.
# TYPE apiserver_audit_requests_rejected_total counter
apiserver_audit_requests_rejected_total 0
# HELP apiserver_client_certificate_expiration_seconds [ALPHA] Distribution of the remaining lifetime on the certificate used to authenticate a request.
# TYPE apiserver_client_certificate_expiration_seconds histogram
apiserver_client_certificate_expiration_seconds_bucket{le="0"} 0
apiserver_client_certificate_expiration_seconds_bucket{le="1800"} 0
(output truncated)
または、マスターノードから、適切な証明書を使用して、認証プロセスをパスするようにcurlコマンドを実行します:
[root@k8s-control-1 ~]# curl -k --cert /tmp/server.crt --key /tmp/server.key https://localhost:10257/metrics

# HELP apiserver_audit_event_total [ALPHA] Counter of audit events generated and sent to the audit backend.
# TYPE apiserver_audit_event_total counter
apiserver_audit_event_total 0
# HELP apiserver_audit_requests_rejected_total [ALPHA] Counter of apiserver requests rejected due to an error in audit logging backend.
# TYPE apiserver_audit_requests_rejected_total counter
apiserver_audit_requests_rejected_total 0
# HELP apiserver_client_certificate_expiration_seconds [ALPHA] Distribution of the remaining lifetime on the certificate used to authenticate a request.
# TYPE apiserver_client_certificate_expiration_seconds histogram
apiserver_client_certificate_expiration_seconds_bucket{le="0"} 0
apiserver_client_certificate_expiration_seconds_bucket{le="1800"} 0

(output truncated)
Prometheusでkube-controller-managerのメトリクスをスクレイピングするための設定方法
kube-controller-managerのメトリクスをスクレイピングする場合、kube-controller-managerが0.0.0.0でリスニングすることが必須となります。そうしないと、Prometheus Podや外部のPrometheusサービスがメトリクスのエンドポイントに到達することができません。kube-controller-managerからメトリクスをスクレイピングするために、
kubernetes_sd_config Pod roleに依存させます。先ほど説明した、Kubernetesクラスター内のどのPodからでもメトリクスエンドポイントにアクセスできるようにする、ということを念頭に置いてください。 prometheus.yml の設定ファイルに適切なジョブを設定するだけです。これは、Community Prometheus Helm Chartにアウトオブボックスで含まれているデフォルトジョブです。
scrape_configs:
- honor_labels: true
    job_name: kubernetes-pods
    kubernetes_sd_configs:
    - role: pod
    relabel_configs:
    - action: keep
        regex: true
        source_labels:
        - __meta_kubernetes_pod_annotation_prometheus_io_scrape
    - action: replace
        regex: (https?)
        source_labels:
        - __meta_kubernetes_pod_annotation_prometheus_io_scheme
        target_label: __scheme__
    - action: replace
        regex: (.+)
        source_labels:
        - __meta_kubernetes_pod_annotation_prometheus_io_path
        target_label: __metrics_path__
    - action: replace
        regex: (.+?)(?::\d+)?;(\d+)
        replacement: $1:$2
        source_labels:
        - __address__
        - __meta_kubernetes_pod_annotation_prometheus_io_port
        target_label: __address__
    - action: labelmap
        regex: __meta_kubernetes_pod_annotation_prometheus_io_param_(.+)
       replacement: __param_$1
    - action: labelmap
        regex: __meta_kubernetes_pod_label_(.+)
    - action: replace
        source_labels:
        - __meta_kubernetes_namespace
        target_label: namespace
    - action: replace
        source_labels:
        - __meta_kubernetes_pod_name
        target_label: pod
    - action: drop
        regex: Pending|Succeeded|Failed|Completed
        source_labels:
        - __meta_kubernetes_pod_phase
また、これらのPodをスクレイピングできるようにするには、
/etc/kubernetes/manifests/kube-controller-manager.yaml ファイルに次のアノテーションを追加する必要があります。各マスターでこれらのマニフェストを編集すると、新しいkube-controller-manager Podsが作成されます。metadata:
annotations:
prometheus.io/scrape: "true"
prometheus.io/port: "10257"
prometheus.io/scheme: "https"
kube-controller-managerを監視する:どのメトリクスを確認するのか?
この時点で、kube-controller-managerとは何か、そしてなぜインフラストラクチャーにおいてこのコンポーネントを監視することが重要なのかを学びました。Kubernetesコントローラーマネージャを監視するためにPrometheusを設定する方法についてもすでに見てきました。そこで、今度は質問です。kube-controller-managerのメトリクスはどれを監視すべきなのでしょうか?
今すぐこのトピックを取り上げましょう。読み進めてください!
免責事項: kube-controller-managerサーバーのメトリクスは、Kubernetesのバージョンによって異なる場合があります。ここでは、Kubernetes 1.25を使用しました。あなたのバージョンで利用可能なメトリクスは、Kubernetes repoで確認できます。
# HELP workqueue_queue_duration_seconds [ALPHA] How long in seconds an item stays in workqueue before being requested.
# TYPE workqueue_queue_duration_seconds histogram
workqueue_queue_duration_seconds_bucket{name="ClusterRoleAggregator",le="1e-08"} 0
workqueue_queue_duration_seconds_bucket{name="ClusterRoleAggregator",le="1e-07"} 0
workqueue_queue_duration_seconds_bucket{name="ClusterRoleAggregator",le="1e-06"} 0
workqueue_queue_duration_seconds_bucket{name="ClusterRoleAggregator",le="9.999999999999999e-06"} 0
workqueue_queue_duration_seconds_bucket{name="ClusterRoleAggregator",le="9.999999999999999e-05"} 0
workqueue_queue_duration_seconds_bucket{name="ClusterRoleAggregator",le="0.001"} 0
workqueue_queue_duration_seconds_bucket{name="ClusterRoleAggregator",le="0.01"} 0
workqueue_queue_duration_seconds_bucket{name="ClusterRoleAggregator",le="0.1"} 3
workqueue_queue_duration_seconds_bucket{name="ClusterRoleAggregator",le="1"} 3
workqueue_queue_duration_seconds_bucket{name="ClusterRoleAggregator",le="10"} 3
workqueue_queue_duration_seconds_bucket{name="ClusterRoleAggregator",le="+Inf"} 3
workqueue_queue_duration_seconds_sum{name="ClusterRoleAggregator"} 0.237713632
workqueue_queue_duration_seconds_count{name="ClusterRoleAggregator"} 3
これを表現する良い方法は、分位数を使うことです。以下の例では、kube-controller-managerがワークキュー内のアイテムを処理するのに要した時間の99パーセンタイルを確認することができます。
histogram_quantile(0.99,sum(rate(workqueue_queue_duration_seconds_bucket{container="kube-controller-manager"}[5m])) by (instance, name, le))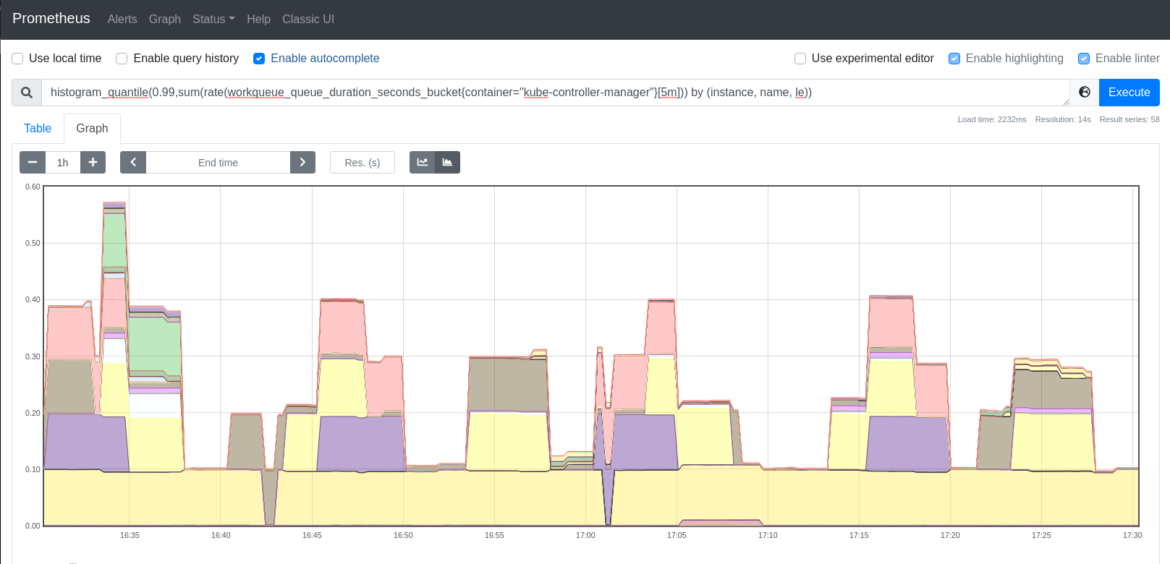
workqueue_adds_total: このメトリクスは、ワークキューで処理された追加数を測定します。高い値は、クラスタや一部のノードに問題があることを示しているかもしれません。# HELP workqueue_adds_total [ALPHA] Total number of adds handled by workqueue
# TYPE workqueue_adds_total counter
workqueue_adds_total{name="ClusterRoleAggregator"} 3
workqueue_adds_total{name="DynamicCABundle-client-ca-bundle"} 1
workqueue_adds_total{name="DynamicCABundle-csr-controller"} 5
workqueue_adds_total{name="DynamicCABundle-request-header"} 1
workqueue_adds_total{name="DynamicServingCertificateController"} 169
workqueue_adds_total{name="bootstrap_signer_queue"} 1
workqueue_adds_total{name="certificate"} 0
workqueue_adds_total{name="claims"} 1346
workqueue_adds_total{name="cronjob"} 0
workqueue_adds_total{name="daemonset"} 591
workqueue_adds_total{name="deployment"} 101066
workqueue_adds_total{name="disruption"} 30
workqueue_adds_total{name="disruption_recheck"} 0
kube-controller-managerのワークキューへの追加率を確認したい場合があります。以下のクエリーを実行して追加率を確認します。
sum(rate(workqueue_adds_total{container="kube-controller-manager"}[5m])) by (instance, name)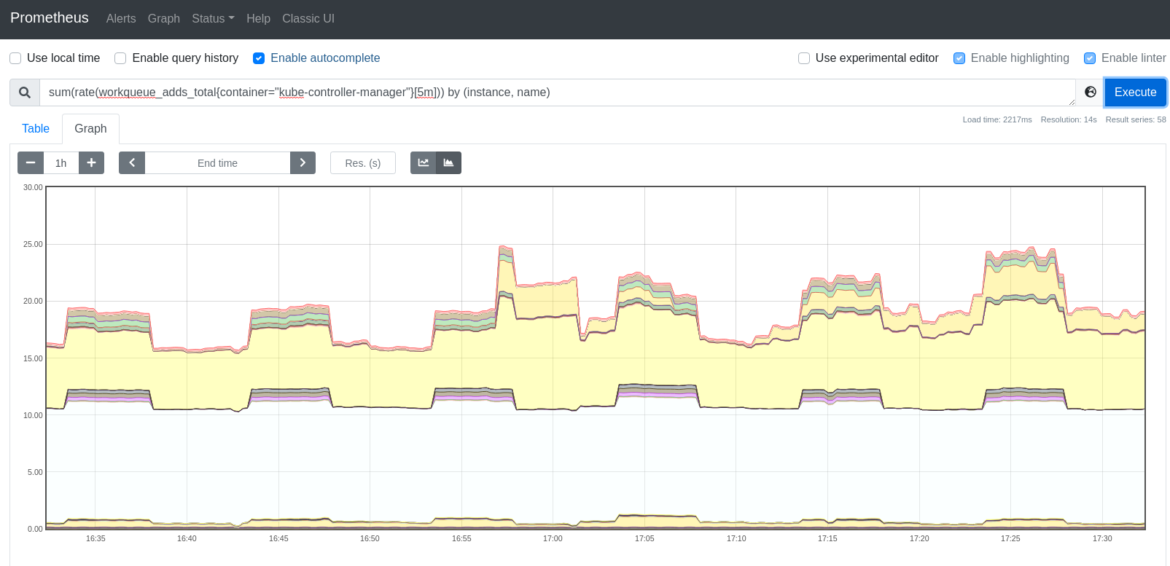
workqueue_depth: ワークキューがどれくらいの大きさなのかを検証できるメトリクスです。ワークキューに処理待ちのアクションがいくつあるか?これは低い値のままであるべきです。以下のクエリーを使用すると、kube-controller-managerのキューの増加率を簡単に確認することができます。ワークキューが大きくなればなるほど、処理しなければならないことが多くなります。したがって、ワークキューの増加傾向は、Kubernetesクラスターに問題があることを示している可能性があります。sum(rate(workqueue_depth{container="kube-controller-manager"}[5m])) by (instance, name)# HELP workqueue_depth [ALPHA] Current depth of workqueue
# TYPE workqueue_depth gauge
workqueue_depth{name="ClusterRoleAggregator"} 0
workqueue_depth{name="DynamicCABundle-client-ca-bundle"} 0
workqueue_depth{name="DynamicCABundle-csr-controller"} 0
workqueue_depth{name="DynamicCABundle-request-header"} 0
workqueue_depth{name="DynamicServingCertificateController"} 0
workqueue_depth{name="bootstrap_signer_queue"} 0
workqueue_depth{name="certificate"} 0
workqueue_depth{name="claims"} 0
workqueue_depth{name="cronjob"} 0
workqueue_depth{name="daemonset"} 0
workqueue_depth{name="deployment"} 0
workqueue_depth{name="disruption"} 0
workqueue_depth{name="disruption_recheck"} 0
workqueue_depth{name="endpoint"} 0
rest_client_request_duration_seconds_bucket: このメトリクスは、APIサーバーへの呼び出しのレイテンシーまたは秒単位の継続時間を測定します。kube-controller-managerとAPI間の通信を監視し、これらの要求が想定時間内に応答されているかどうかを確認するのに適しています。# HELP rest_client_request_duration_seconds [ALPHA] Request latency in seconds. Broken down by verb, and host.
# TYPE rest_client_request_duration_seconds histogram
rest_client_request_duration_seconds_bucket{host="192.168.119.30:6443",verb="GET",le="0.005"} 15932
rest_client_request_duration_seconds_bucket{host="192.168.119.30:6443",verb="GET",le="0.025"} 28868
rest_client_request_duration_seconds_bucket{host="192.168.119.30:6443",verb="GET",le="0.1"} 28915
rest_client_request_duration_seconds_bucket{host="192.168.119.30:6443",verb="GET",le="0.25"} 28943
rest_client_request_duration_seconds_bucket{host="192.168.119.30:6443",verb="GET",le="0.5"} 29001
rest_client_request_duration_seconds_bucket{host="192.168.119.30:6443",verb="GET",le="1"} 29066
rest_client_request_duration_seconds_bucket{host="192.168.119.30:6443",verb="GET",le="2"} 29079
rest_client_request_duration_seconds_bucket{host="192.168.119.30:6443",verb="GET",le="4"} 29079
rest_client_request_duration_seconds_bucket{host="192.168.119.30:6443",verb="GET",le="8"} 29081
rest_client_request_duration_seconds_bucket{host="192.168.119.30:6443",verb="GET",le="15"} 29081
rest_client_request_duration_seconds_bucket{host="192.168.119.30:6443",verb="GET",le="30"} 29081
rest_client_request_duration_seconds_bucket{host="192.168.119.30:6443",verb="GET",le="60"} 29081
rest_client_request_duration_seconds_bucket{host="192.168.119.30:6443",verb="GET",le="+Inf"} 29081
rest_client_request_duration_seconds_sum{host="192.168.119.30:6443",verb="GET"} 252.18190490699962
rest_client_request_duration_seconds_count{host="192.168.119.30:6443",verb="GET"} 29081
Kubernetes APIサーバーへのリクエストのレイテンシーの99パーセンタイルを計算したい場合は、このクエリーを使用します。
histogram_quantile(0.99, sum(rate(rest_client_request_duration_seconds_bucket{container="kube-controller-manager"}[5m])) by (url, le))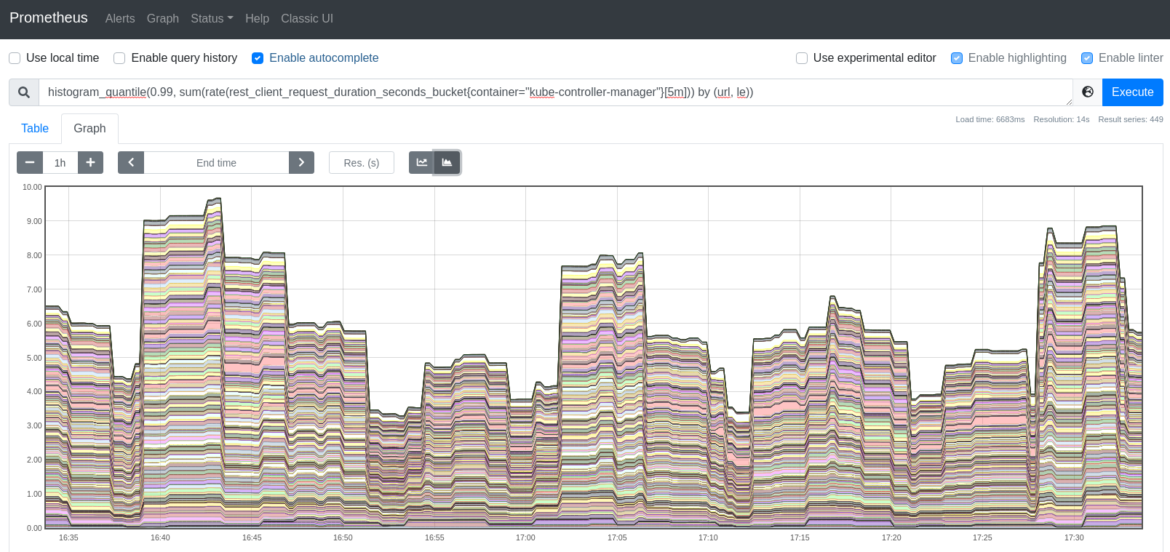
rest_client_requests_total: このメトリクスは、kube-controller-managerに対するHTTPクライアントリクエストの数をHTTPレスポンスコード別に提供します。# HELP rest_client_requests_total [ALPHA] Number of HTTP requests, partitioned by status code, method, and host.
# TYPE rest_client_requests_total counter
rest_client_requests_total{code="200",host="192.168.119.30:6443",method="GET"} 31308
rest_client_requests_total{code="200",host="192.168.119.30:6443",method="PATCH"} 114
rest_client_requests_total{code="200",host="192.168.119.30:6443",method="PUT"} 5543
rest_client_requests_total{code="201",host="192.168.119.30:6443",method="POST"} 34
rest_client_requests_total{code="503",host="192.168.119.30:6443",method="GET"} 9
rest_client_requests_total{code="<error>",host="192.168.119.30:6443",method="GET"} 2
HTTP 2xxクライアントリクエストのレートを取得したい場合は、以下のクエリーを実行します。これは、HTTP成功リクエストのレートをレポートします。
sum(rate(rest_client_requests_total{container="kube-controller-manager",code=~"2.."}[5m]))HTTP 3xxクライアントリクエストのレートは、以下のクエリーを使用します。HTTPリダイレクトのリクエスト数に対するレートが表示されます。sum(rate(rest_client_requests_total{container="kube-controller-manager",code=~"3.."}[5m]))次のクエリーは、クライアントエラーHTTPリクエストのレートを表示します。これを徹底的に監視して、クライアントエラーレスポンスを検出します。
sum(rate(rest_client_requests_total{container="kube-controller-manager",code=~"4.."}[5m]))最後に、サーバーエラーのHTTPリクエストを監視したい場合は、以下のクエリーを使用します。
sum(rate(rest_client_requests_total{container="kube-controller-manager",code=~"5.."}[5m]))process_cpu_seconds_total: インスタンスごとの kube-controller-manager に費やされた CPU 時間の合計(秒)です。# HELP process_cpu_seconds_total Total user and system CPU time spent in seconds.
# TYPE process_cpu_seconds_total counter
process_cpu_seconds_total 279.2
以下のクエリーを実行することで、CPUレートの消費時間を取得することができます。
rate(process_cpu_seconds_total{container="kube-controller-manager"}[5m])process_resident_memory_bytes: このメトリクスは、インスタンスごとのkube-controller-managerの常駐メモリサイズをバイト単位で測定します。# HELP process_resident_memory_bytes Resident memory size in bytes.
# TYPE process_resident_memory_bytes gauge
process_resident_memory_bytes 1.4630912e+08
このクエリーで簡単にkube-controller-managerの常駐メモリサイズを監視することができます。
rate(process_resident_memory_bytes{container="kube-controller-manager"}[5m])まとめ
今回は、Kubernetesコントローラーマネージャが、ウォッチ機構を介してKubernetes APIと通信することで、Kubernetesオブジェクトの望ましい状態に到達させる役割を担っていることを学びました。この内部コンポーネントは、Kubernetesのコントロールプレーン内の重要なピースであり、何か問題が発生した場合の防御のためにkube-controller-managerを監視することが鍵となります。kube-controller-managerを監視し、問題のトラブルシューティングを最大10倍高速化します。
Sysdigは、Sysdig Monitorに含まれるアウトオブボックスのダッシュボードで、kube-controller-managerやKubernetesコントロールプレーンの他の部分の問題の監視とトラブルシューティングを支援します。Sysdig Monitorに統合されたツールであるAdvisorは、Kubernetesクラスターとそのワークロードのトラブルシューティングを最大10倍まで加速させます。
30日間のトライアルアカウントにサインアップして、ご自身でお試しください!