
本文の内容は、2021年5月13日に Jesus Ángel Samitierが投稿したブログ(https://sysdig.com/blog/kubernetes-capacity-planning)を元に日本語に翻訳・再構成した内容となっております。
Kubernetesのキャパシティプランニングは、インフラエンジニアが直面しなければならない主な課題の一つです。Kubernetesのリミットとリクエストを理解することは簡単なことではありません。
コンテナがメモリ不足になったり、CPUスロットルされたりしないように、必要以上のリソースを予約しているかもしれません。このような状況に陥ると、使用されていなくてもそれらのリソースに対して課金されることになり、デプロイのスケジュールも難しくなります。そのため、Kubernetesのキャパシティプランニングは、クラスターの安定性や信頼性と、リソースの正しい使い方とのバランスを常に考慮する必要があるのです。
この記事では、使用されていないリソースを特定する方法と、クラスターのキャパシティを適切なサイズにする方法を学びます。
欲張りな開発者にならないために
コンテナが必要以上のリソースを要求する場面があります。それがただのコンテナであれば、クラウドプロバイダーからの請求書に重大な影響を与えることはないかもしれません。しかし、すべてのコンテナでこのようなことが起こると、大規模なクラスターでは請求書にいくつかの余分なコストがかかることになります。
言うまでもなく、ポッドが大きすぎると、スケジューリングの問題をデバッグするのに余計な労力を使うことになります。結局のところ、Kubernetesがあなたの優先順位に従って大きなPodをスケジューリングするのは難しいのです。
Kubernetesのキャパシティプランニングには、2つのオープンソースツールが役立ちます。
- kube-state-metrics:クラスターレベルのメトリクスを生成して公開するアドオンエージェント
- CAdvisor:コンテナのリソース使用状況を分析するツール
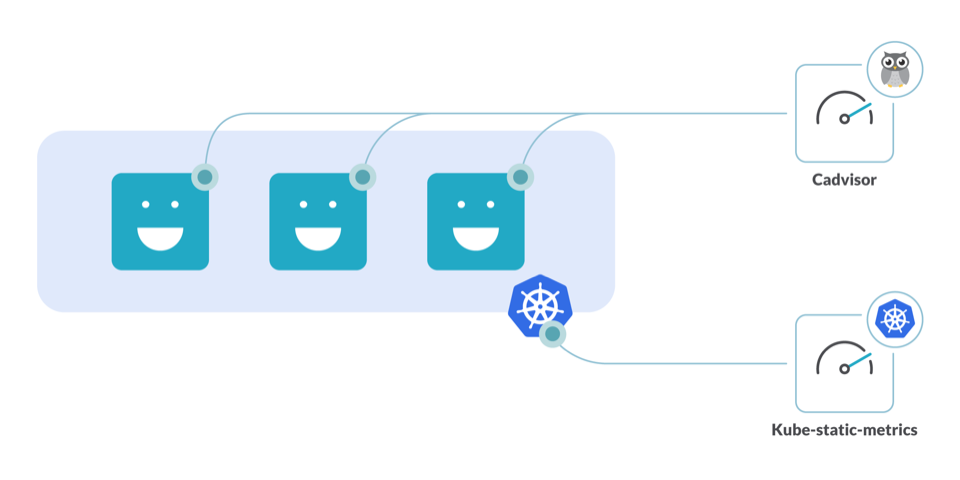
これらのツールをクラスター内で実行することで、リソースの使用不足を回避し、クラスターへのリクエストを適切なサイズにすることができます。
使用されていないリソースを検出する方法
CPU
コンピューティングキャパシティは最もデリケートな調整項目の1つで、リクエストを低く設定することでノードをスロットルさせるのは簡単です。逆に、多くのコアを要求することでこの問題を解決しようとすると、ほとんどアイドル状態のクラスターノードになってしまいます。
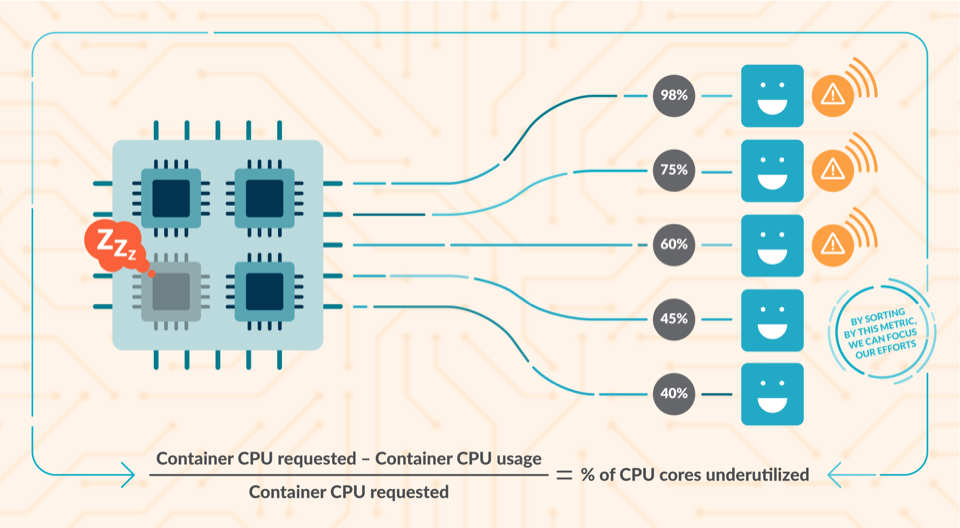
各コンテナには、片側にCPU使用率のパーセンテージ(2%、25%…)が表示されています。CPUの使用率が低いものには警告が表示されます。図の下部には、CPUリソースの使用不足を計算するために使用した簡単な式が表示されています。(使用可能なコンテナのCPU – 使用可能なコンテナのCPU) / 使用可能なコンテナのCPU = 使用されていないCPUコアの割合。
アイドル状態のコアの検出
container_cpu_usage_seconds_total と kube_pod_container_resource_requests で得られた情報を使って、どれだけの CPU コアが利用されていないかを検出できます。
sum((rate(container_cpu_usage_seconds_total{container!="POD",container!=""}[30m]) - on (namespace,pod,container) group_left avg by (namespace,pod,container)(kube_pod_container_resource_requests{resource="cpu"})) * -1 >0)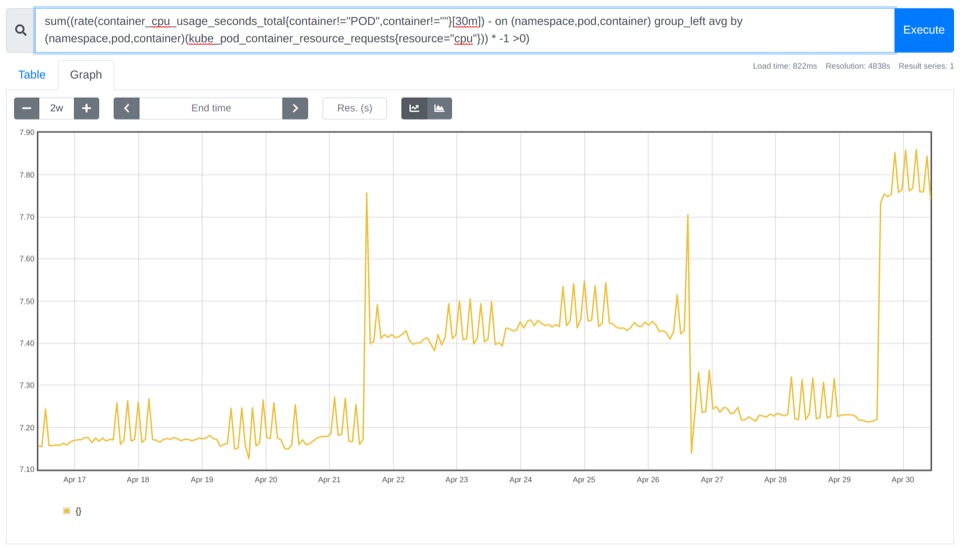
上記の例では、~7.10~7.85個のコアが使用されていないことがわかります。
どのネームスペースがより多くのCPUコアを浪費しているかを特定する方法
先ほどのPromQLクエリーをネームスペースごとに集計することで、より詳細な情報を得ることができます。さらに、過剰なサイズのネームスペースを担当している部署に請求することができるという良い点もあります。
sum by (namespace)((rate(container_cpu_usage_seconds_total{container!="POD",container!=""}[30m]) - on (namespace,pod,container) group_left avg by (namespace,pod,container)(kube_pod_container_resource_requests{resource="cpu"})) * -1 >0)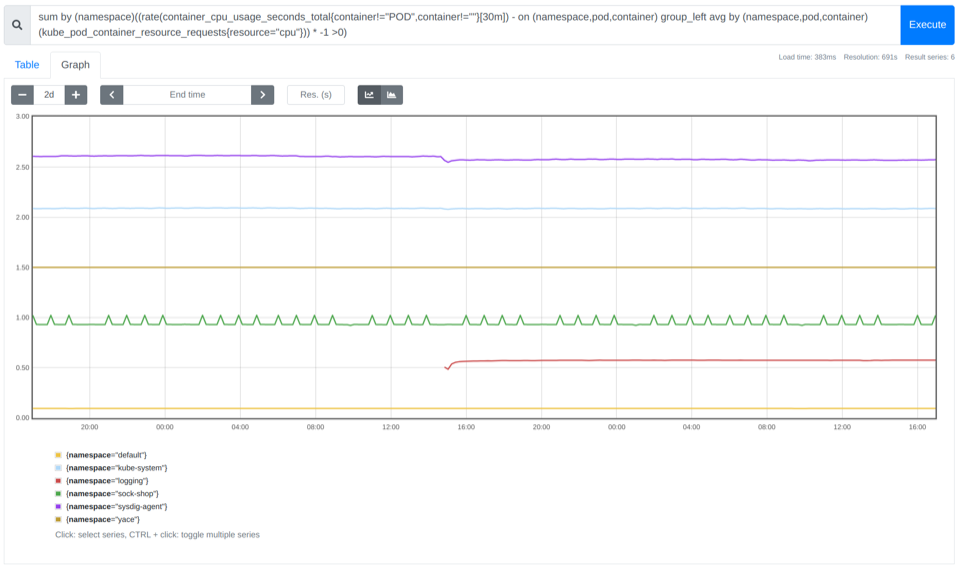
CPUを浪費しているコンテナのトップ10を見つける
PromQLの入門ガイドで説明したように、topk関数を使用すると、PromQLクエリーの上位n個の結果を簡単に得ることができます。以下のようにです:
topk(10,sum by (namespace,pod,container)((rate(container_cpu_usage_seconds_total{container!="POD",container!=""}[30m]) - on (namespace,pod,container) group_left avg by (namespace,pod,container)(kube_pod_container_resource_requests{resource="cpu"})) * -1 >0))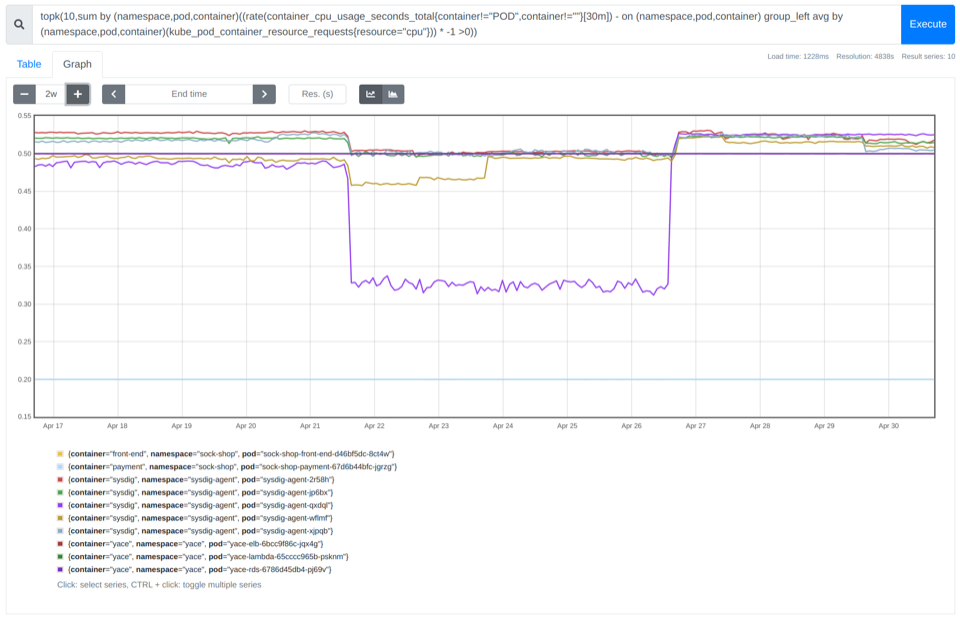
メモリ
メモリプランニングを正しく行うことが重要です。十分なメモリを要求しないと、ノードはメモリ不足になったときにポッドのevictedを開始します。しかし、メモリは有限なので、この設定をうまく調整すれば、より多くのデプロイメントが各ノードに適合するようになります。Out of memory errorについてはこちらをご覧ください。
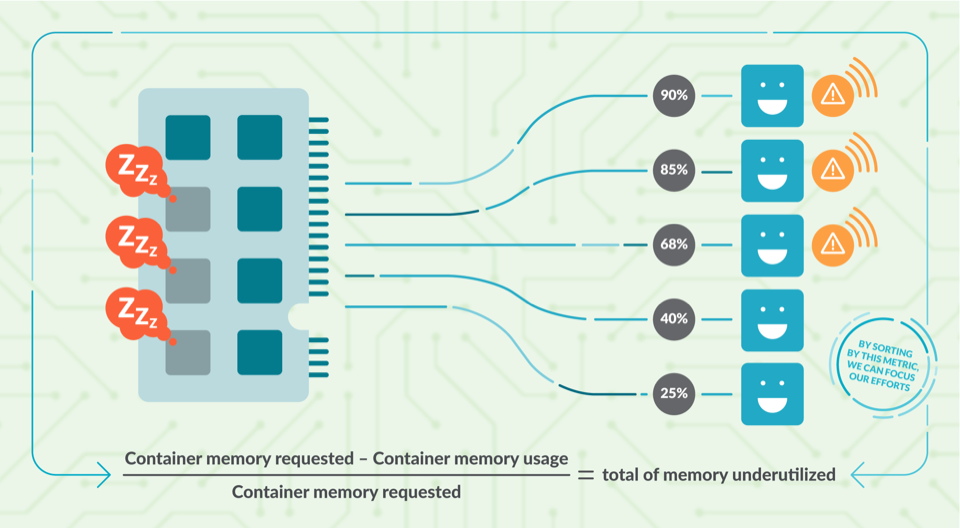
各コンテナには、片側にメモリ使用量の割合が表示されています(2%、25%…)。メモリの使用率が低いものには警告表示があります。図の下部には、メモリリソースの使用不足を計算するために使用した簡単な式が表示されています。(使用可能なコンテナのメモリ – コンテナのメモリ使用量) / 使用可能なコンテナのメモリ = 使用されていないメモリの合計。
使用されていないメモリの検出
container_memory_usage_bytesとkube_pod_container_resource_requestsの情報を使って、どれだけのメモリが無駄に使われているかを確認することができます。
sum((container_memory_usage_bytes{container!="POD",container!=""} - on (namespace,pod,container) avg by (namespace,pod,container)(kube_pod_container_resource_requests{resource="memory"})) * -1 >0 ) / (1024*1024*1024)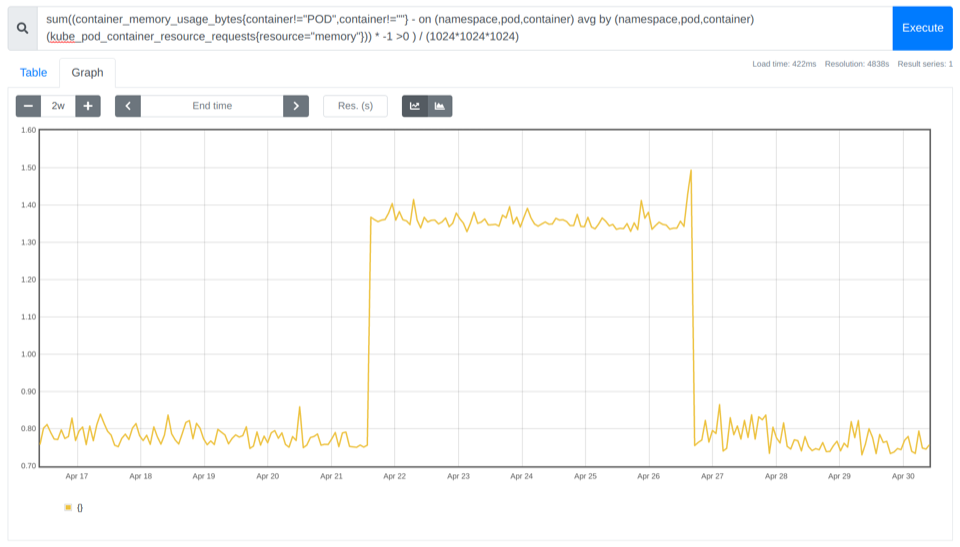
上記の例では、そのクラスターで0.8Gbのコストを削減できたことがわかります。
どのネームスペースがより多くのメモリを浪費しているかを特定する方法
CPUの時と同じように、ネームスペースごとに集計することができます。
sum by (namespace)((container_memory_usage_bytes{container!="POD",container!=""} - on (namespace,pod,container) avg by (namespace,pod,container)(kube_pod_container_resource_requests{resource="memory"})) * -1 >0 ) / (1024*1024*1024)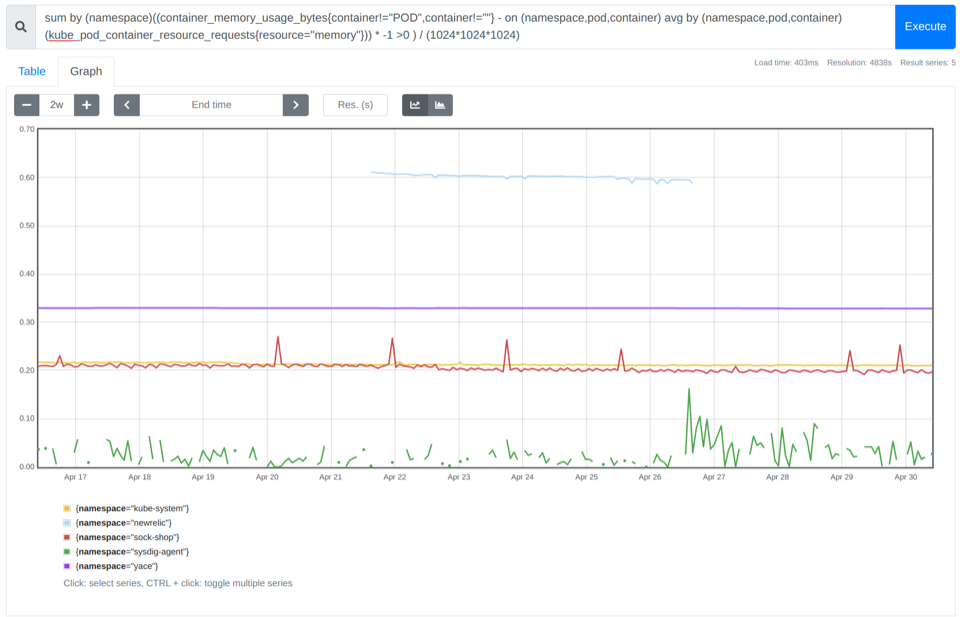
メモリを浪費しているコンテナのトップ10を見つける
再び topk 関数を使用して、各ネームスペース内でより多くのメモリを消費しているコンテナの上位 10 個を特定します。
topk(10,sum by (namespace,pod,container)((container_memory_usage_bytes{container!="POD",container!=""} - on (namespace,pod,container) avg by (namespace,pod,container)(kube_pod_container_resource_requests{resource="memory"})) * -1 >0 ) / (1024*1024*1024))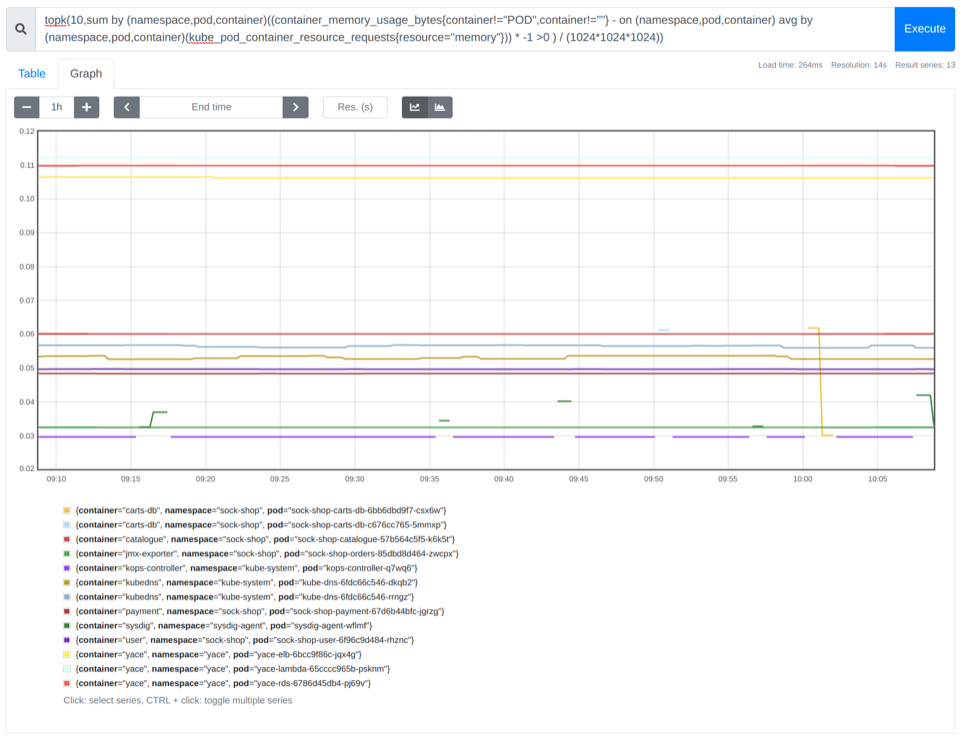
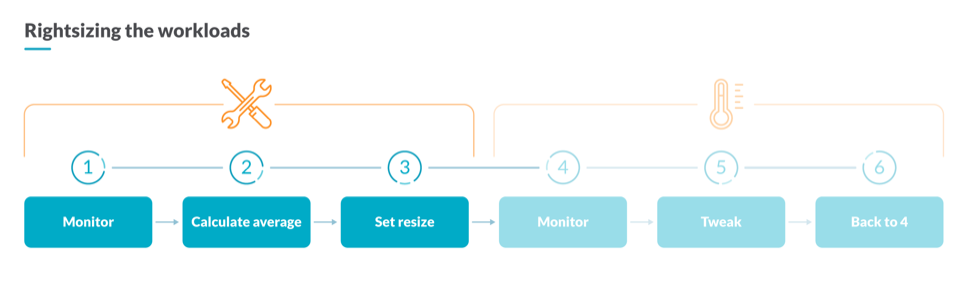
コンテナのリクエストを適切なサイズにする方法
Kubernetesのキャパシティプランニングでは、適切な量の計算リソースを確保するために、コンテナの現在のリソース使用状況を分析する必要があります。そのためには、同じワークロードに属するすべてのコンテナの平均CPU使用率を計算する、このPromQLクエリーを使用することができます。ワークロードをDeployment、StatefulSet、またはDaemonSetとして理解します。
avg by (namespace,owner_name,container)((rate(container_cpu_usage_seconds_total{container!="POD",container!=""}[5m])) * on(namespace,pod) group_left(owner_name) avg by (namespace,pod,owner_name)(kube_pod_owner{owner_kind=~"DaemonSet|StatefulSet|Deployment"}))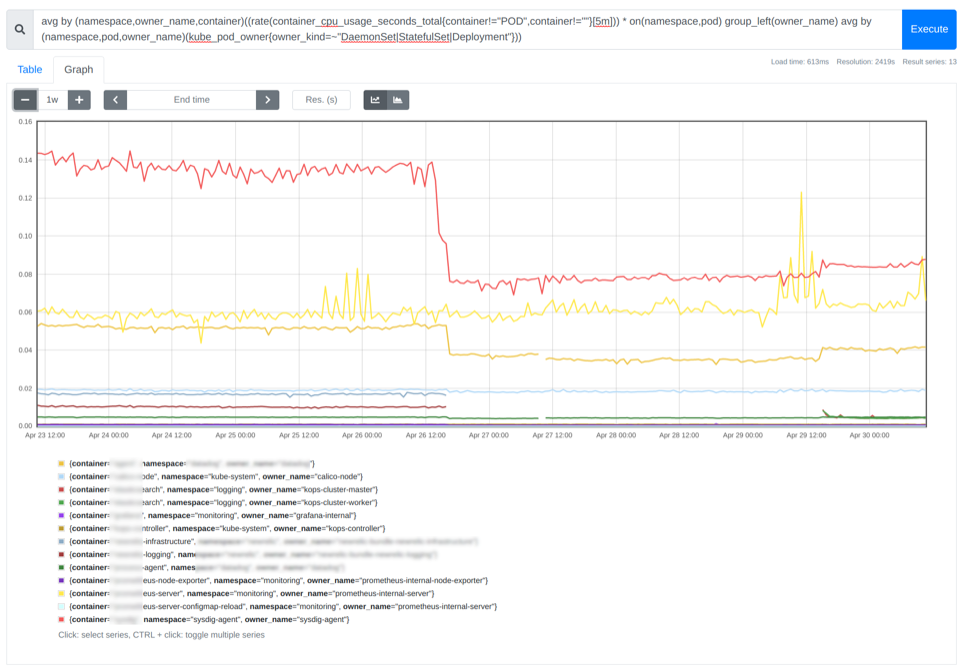
各コンテナの平均CPU使用率の計算に使用したPromQLクエリーの結果を示すPrometheusチャートのスクリーンショット。この値は、どのようなCPUリクエストを設定すべきかを判断するのに役立ちます。
上の画像では、各コンテナの平均CPU使用率を確認できます。目安としては、CPUまたはメモリの平均使用率の85%から115%の間の値でコンテナのリクエストを設定することができます。
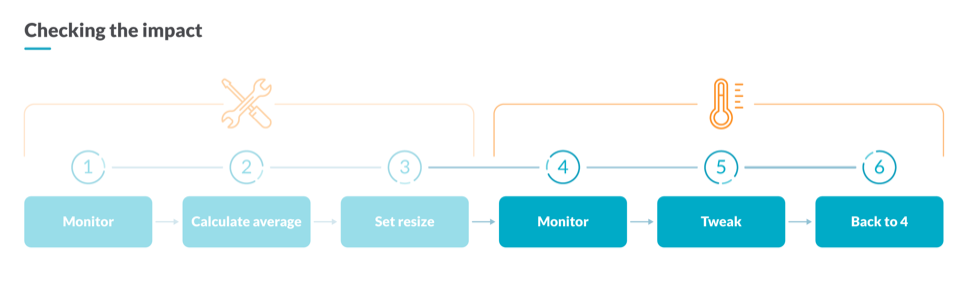
最適化の効果を測定する方法
Kubernetesのキャパシティプランニングオペレーションを行った後は、変更によるインフラへの影響を確認する必要があります。そのためには、現在活用されていないCPUコアを1週間前の値と比較して、最適化の影響を評価することができます。
sum((rate(container_cpu_usage_seconds_total{container!="POD",container!=""}[30m]) - on (namespace,pod,container) group_left avg by (namespace,pod,container)(kube_pod_container_resource_requests{resource="cpu"})) * -1 >0) - sum((rate(container_cpu_usage_seconds_total{container!="POD",container!=""}[30m] offset 1w) - on (namespace,pod,container) group_left avg by (namespace,pod,container)(kube_pod_container_resource_requests{resource="cpu"} offset 1w )) * -1 >0)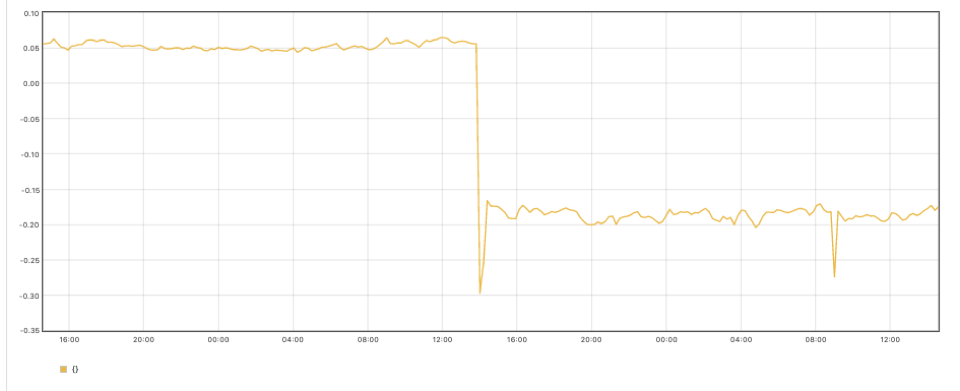
上のグラフでは、これまでの最適化を適用した後、クラスター内の未使用コアが少なくなっていることがわかります。
すべてをまとめると
これで、欲張りな開発者に関する問題の結果と、プラットフォームにおけるリソースの過剰割り当てを検出する方法がわかりました。また、コンテナのリクエストを適切なサイズにする方法や、最適化の効果を測定する方法についても学びました。
これらのヒントは、包括的なKubernetesキャパシティプランニングダッシュボードを構築し、プラットフォームリソースの最適化に必要なすべての情報を1枚のガラスに収めるための良い出発点となるはずです。
Sysdigを活用したKubernetesキャパシティプランニングの方法
私たちSysdigは、自らKubernetesを使用し、毎日何百人ものお客様のクラスターをサポートしています。これらの専門知識を、すぐに使えるKubernetesダッシュボードでお客様と共有できることを嬉しく思います。適切なダッシュボードがあれば、クラスタのトラブルシューティングやKubernetesのキャパシティプランニングを行うのに、専門家である必要はありません。
すぐに使えるKubernetesダッシュボードを活用すると、数回クリックするだけで活用されていないリソースを発見することができます。
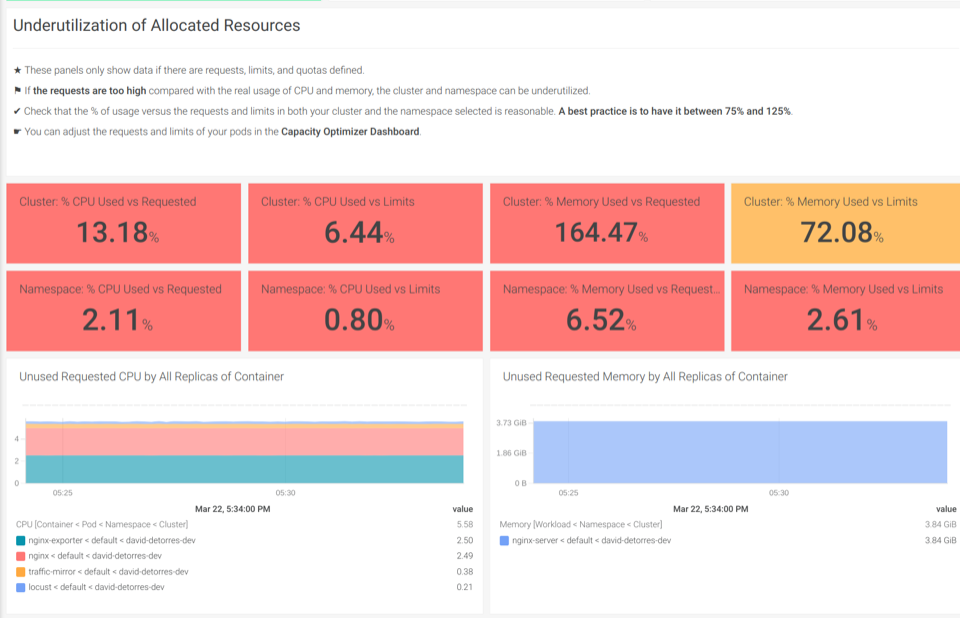
Underutilization of Allocated Resourcesのダッシュボードでは、使用されていないCPUやメモリがあるかどうかを見つけることができます
また、Sysdig Monitorの無料トライアルに登録して、すぐに使えるKubernetesダッシュボードをお試しいただけます。